Blue Book Services
Modernizing a 124-year-old market intelligence platform — and proposing what's next. Two case studies shipped: a 30% subscription revenue lift and a new acquisition funnel that generated $420K in its first three months. A third — an AI vision — proposes where the platform should go next.
Owned product strategy across pricing, conversion, modernization, and a proposed AI roadmap. +30% subscription revenue per member at 98% retention. $420K in new ARR in 90 days. Plus a vision for what comes next — a $4B AI-runtime opportunity built on Blue Book's proprietary 124-year trust graph.
By 2023, Blue Book Services — the trusted source of credit ratings and trade reputation for the produce industry since 1901 — had plateaued. Costly external dev agencies, a legacy .NET stack, declining customer satisfaction, and stagnant acquisition were holding back innovation while competition caught up.
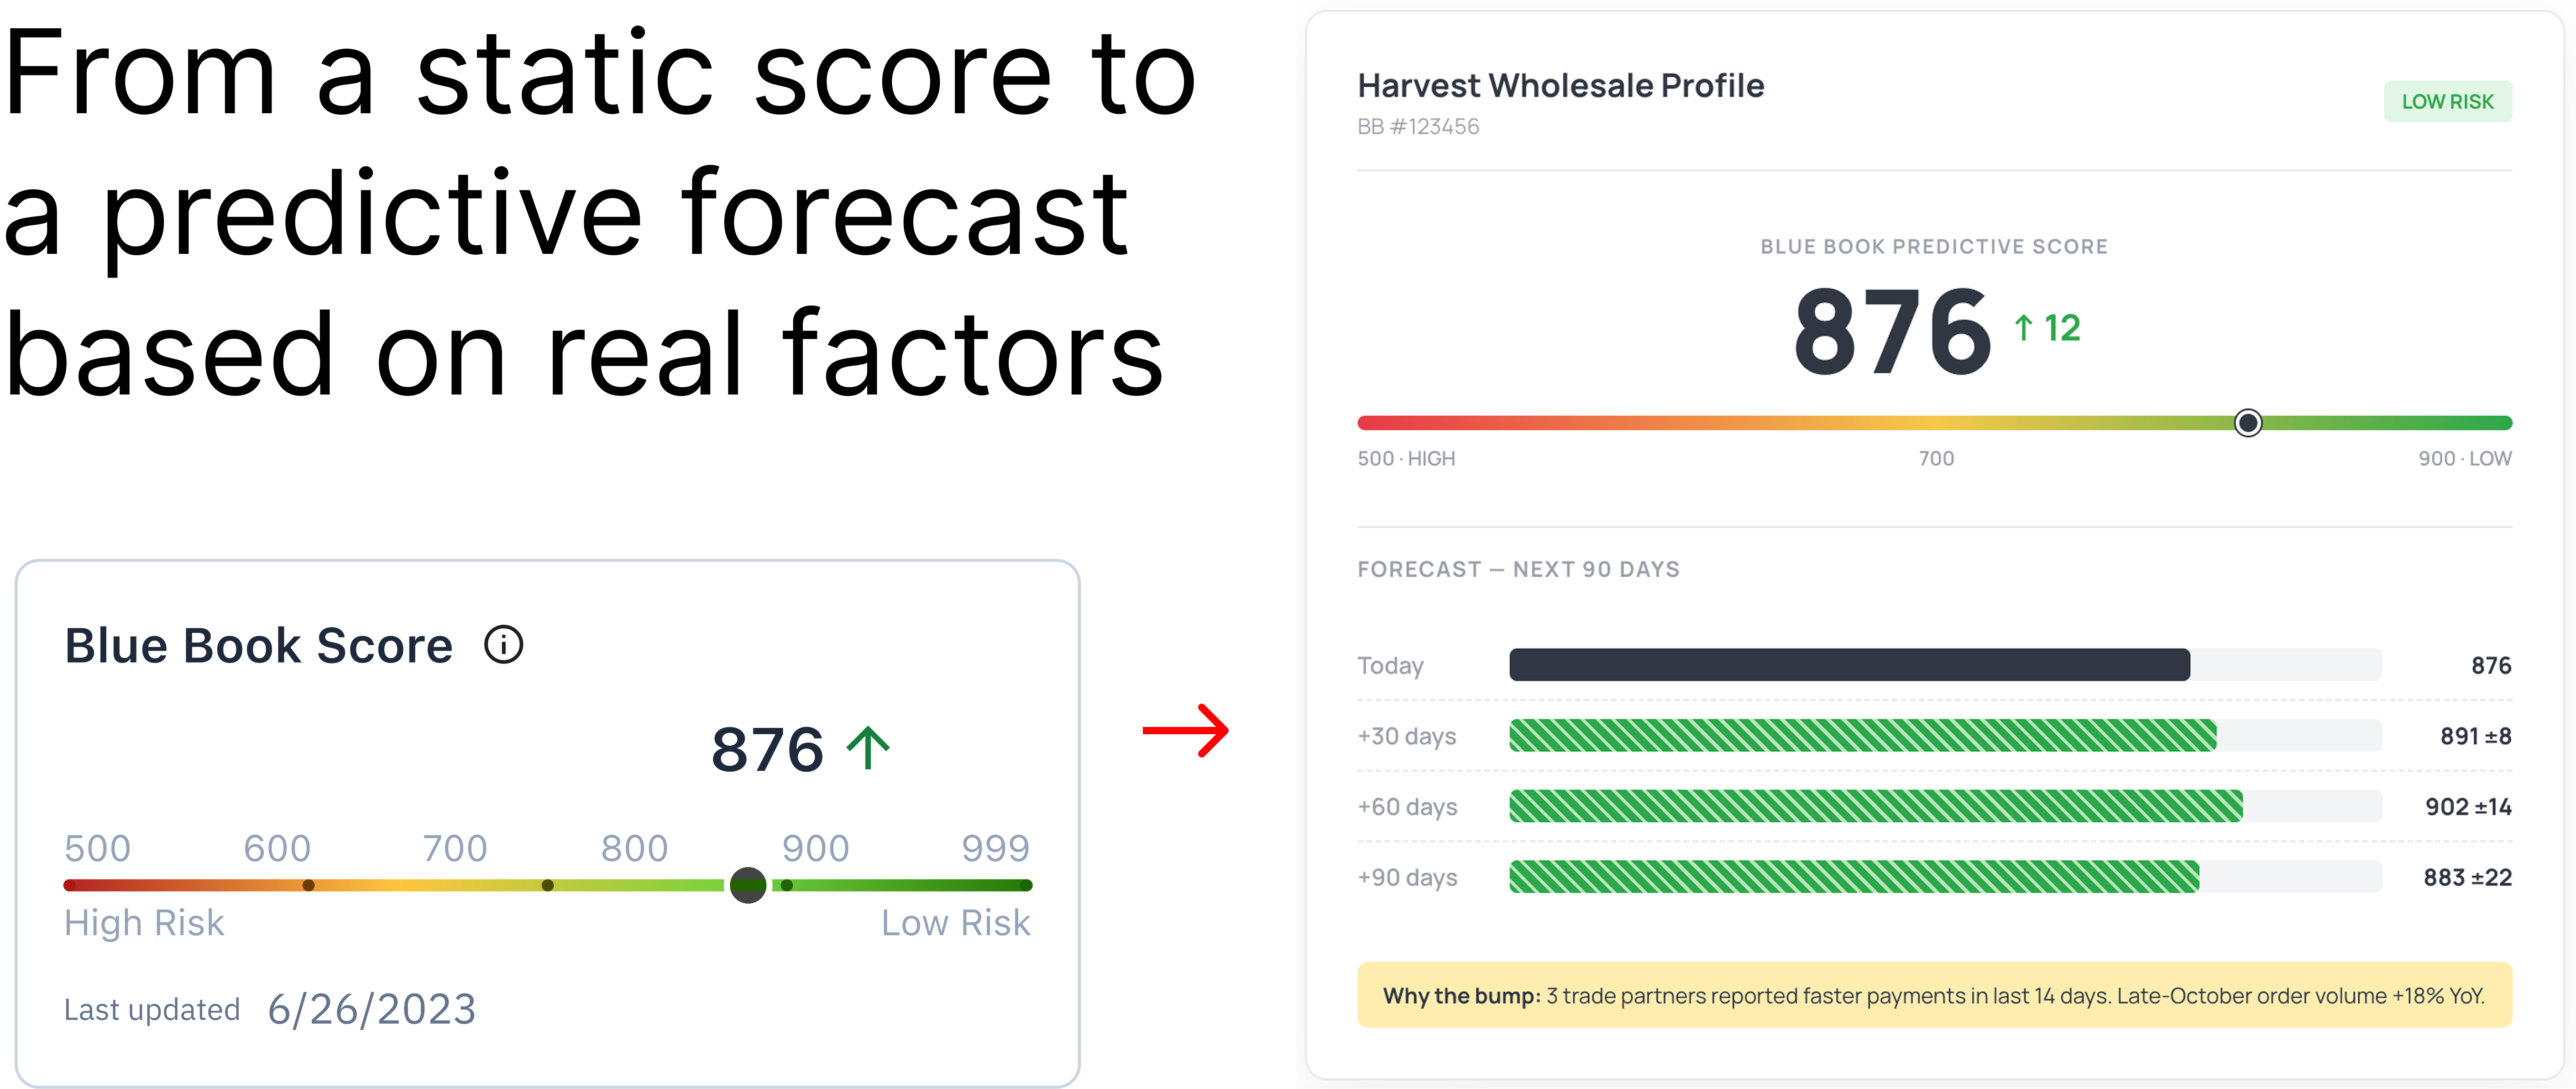
For existing customers: the platform was outdated, hard to use, and the Blue Book Score itself was unreadable — 95% of customers used a PDF cheat sheet to interpret it.
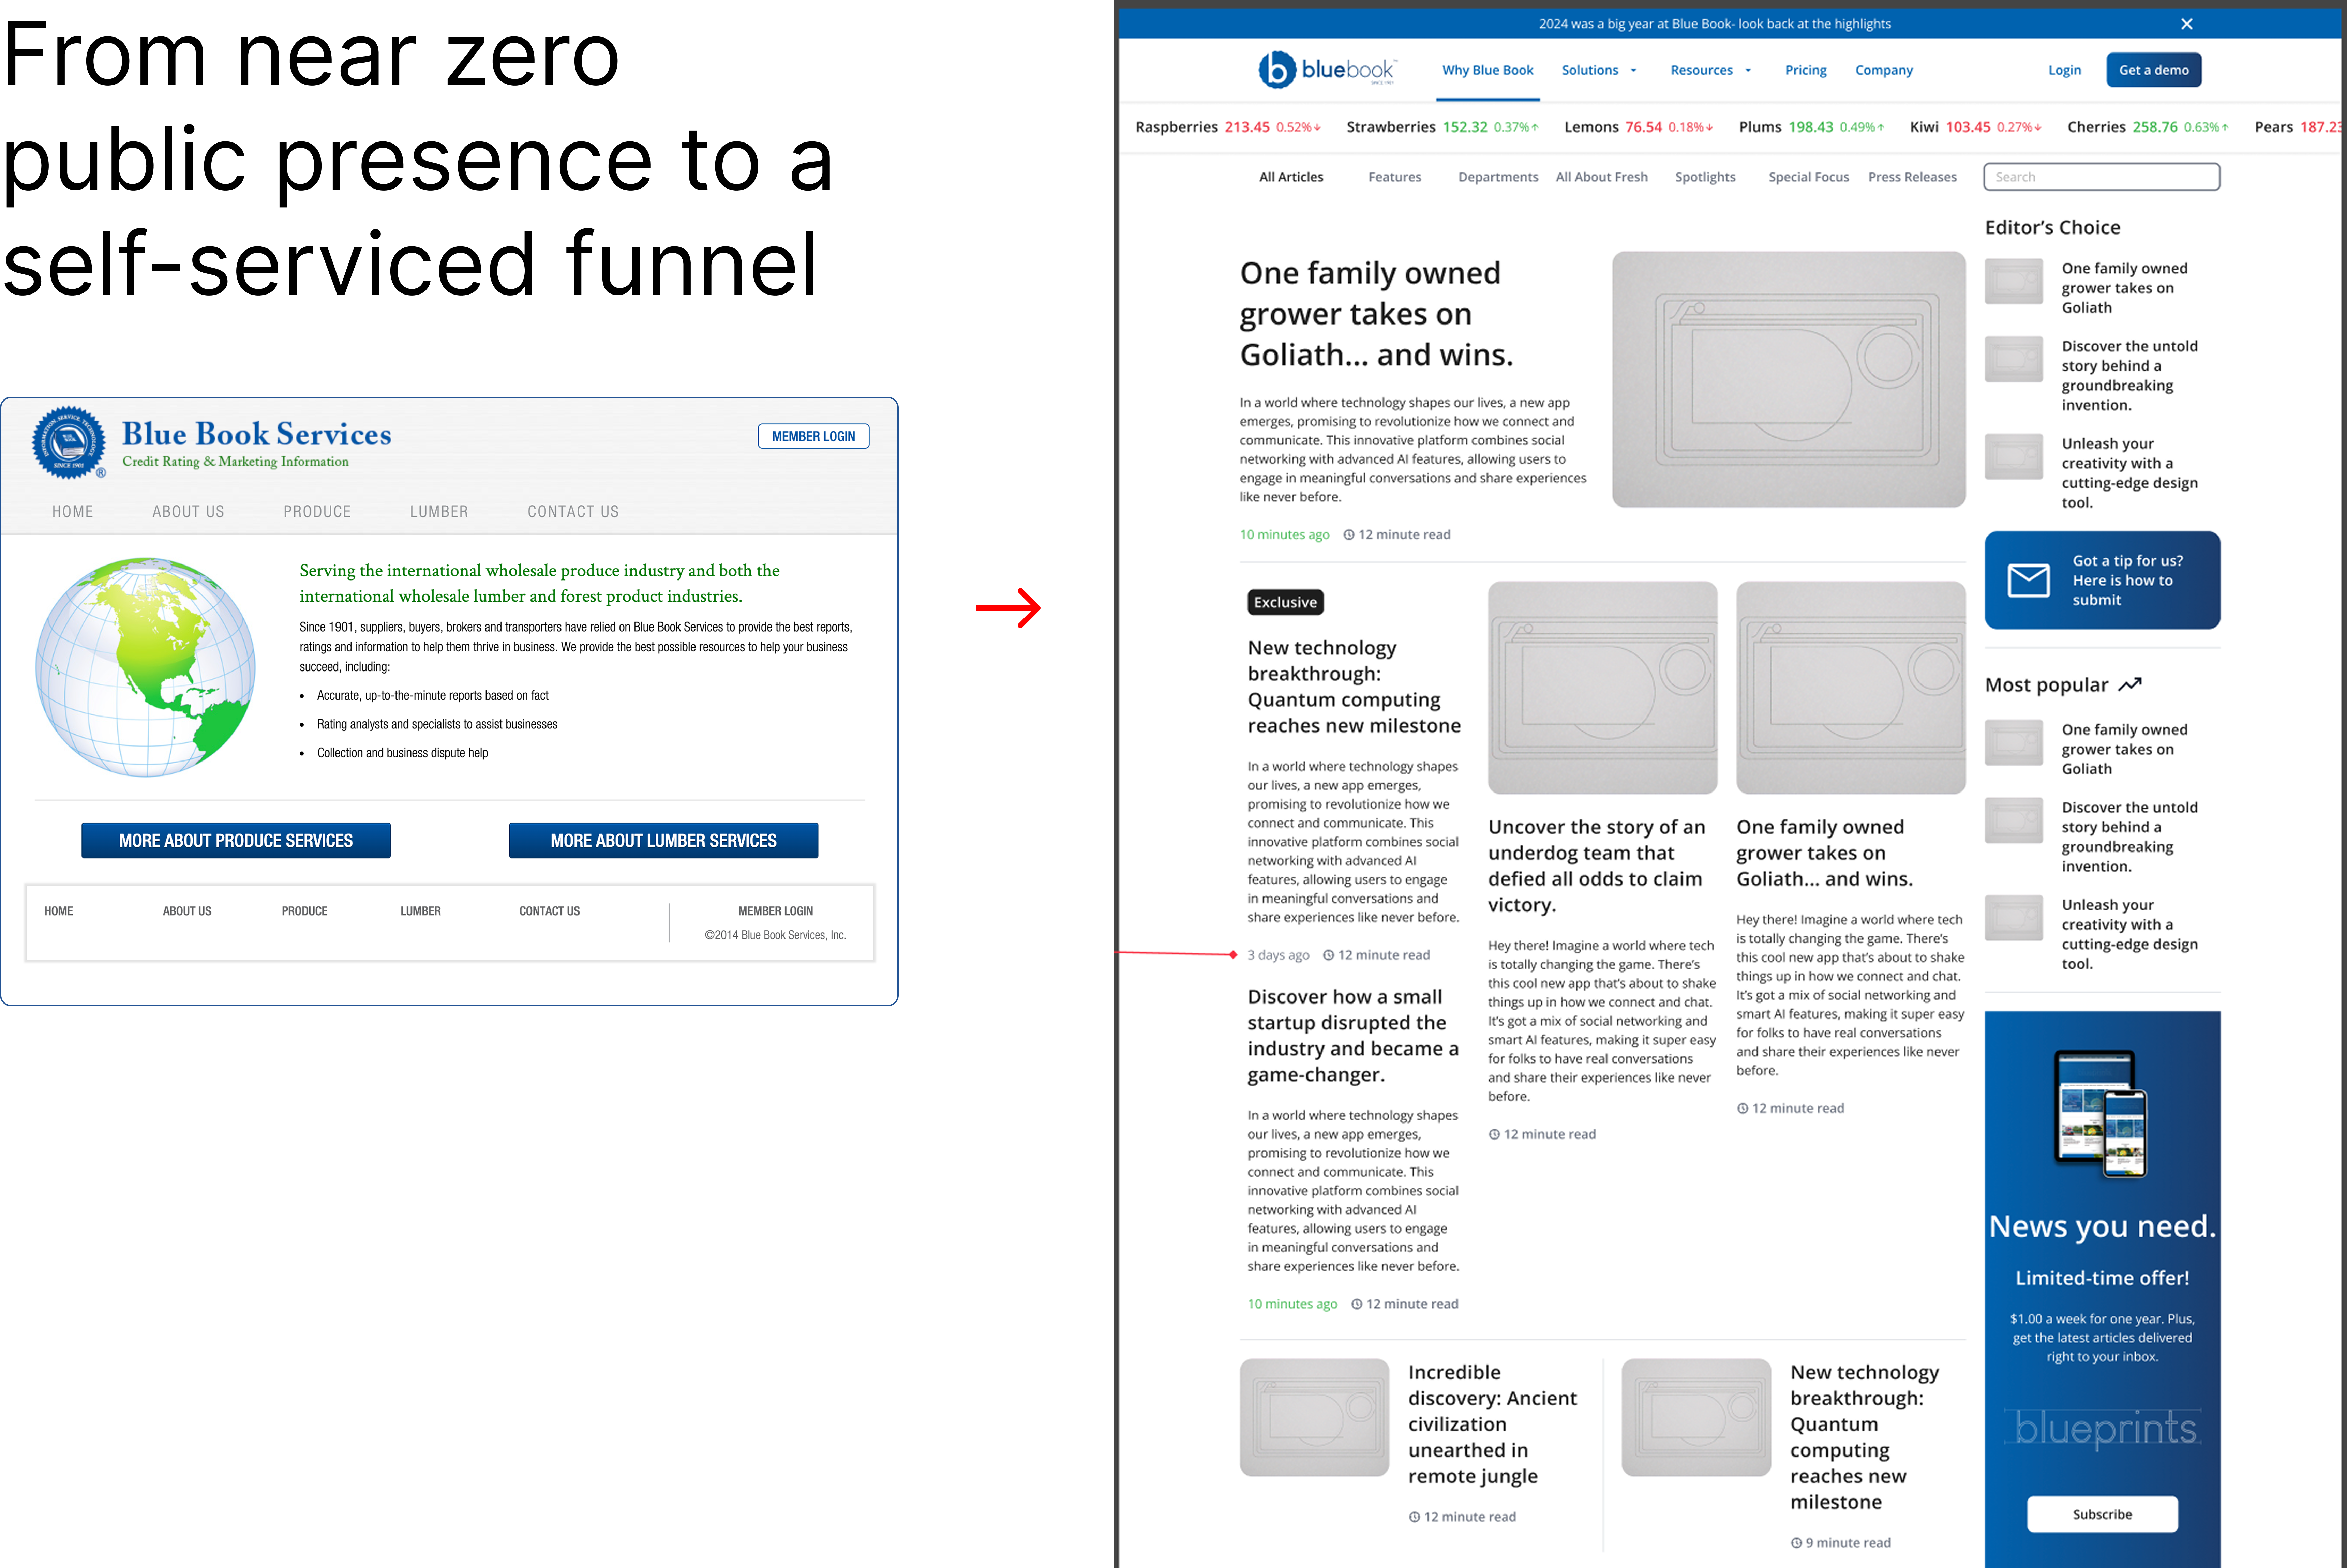
For new customers: the marketing site was a static directory split across three domains, drew 842 weekly visitors, and offered no analytics. New visitors couldn't tell what Blue Book did for them in 5 seconds.
Two delivered case studies — modernization, then acquisition — anchored by a four-pillar framework. A third proposed case study extends the same framework into an AI runtime.
CASE 1
Modernize the platform
→
CASE 2
Build the acquisition engine
→
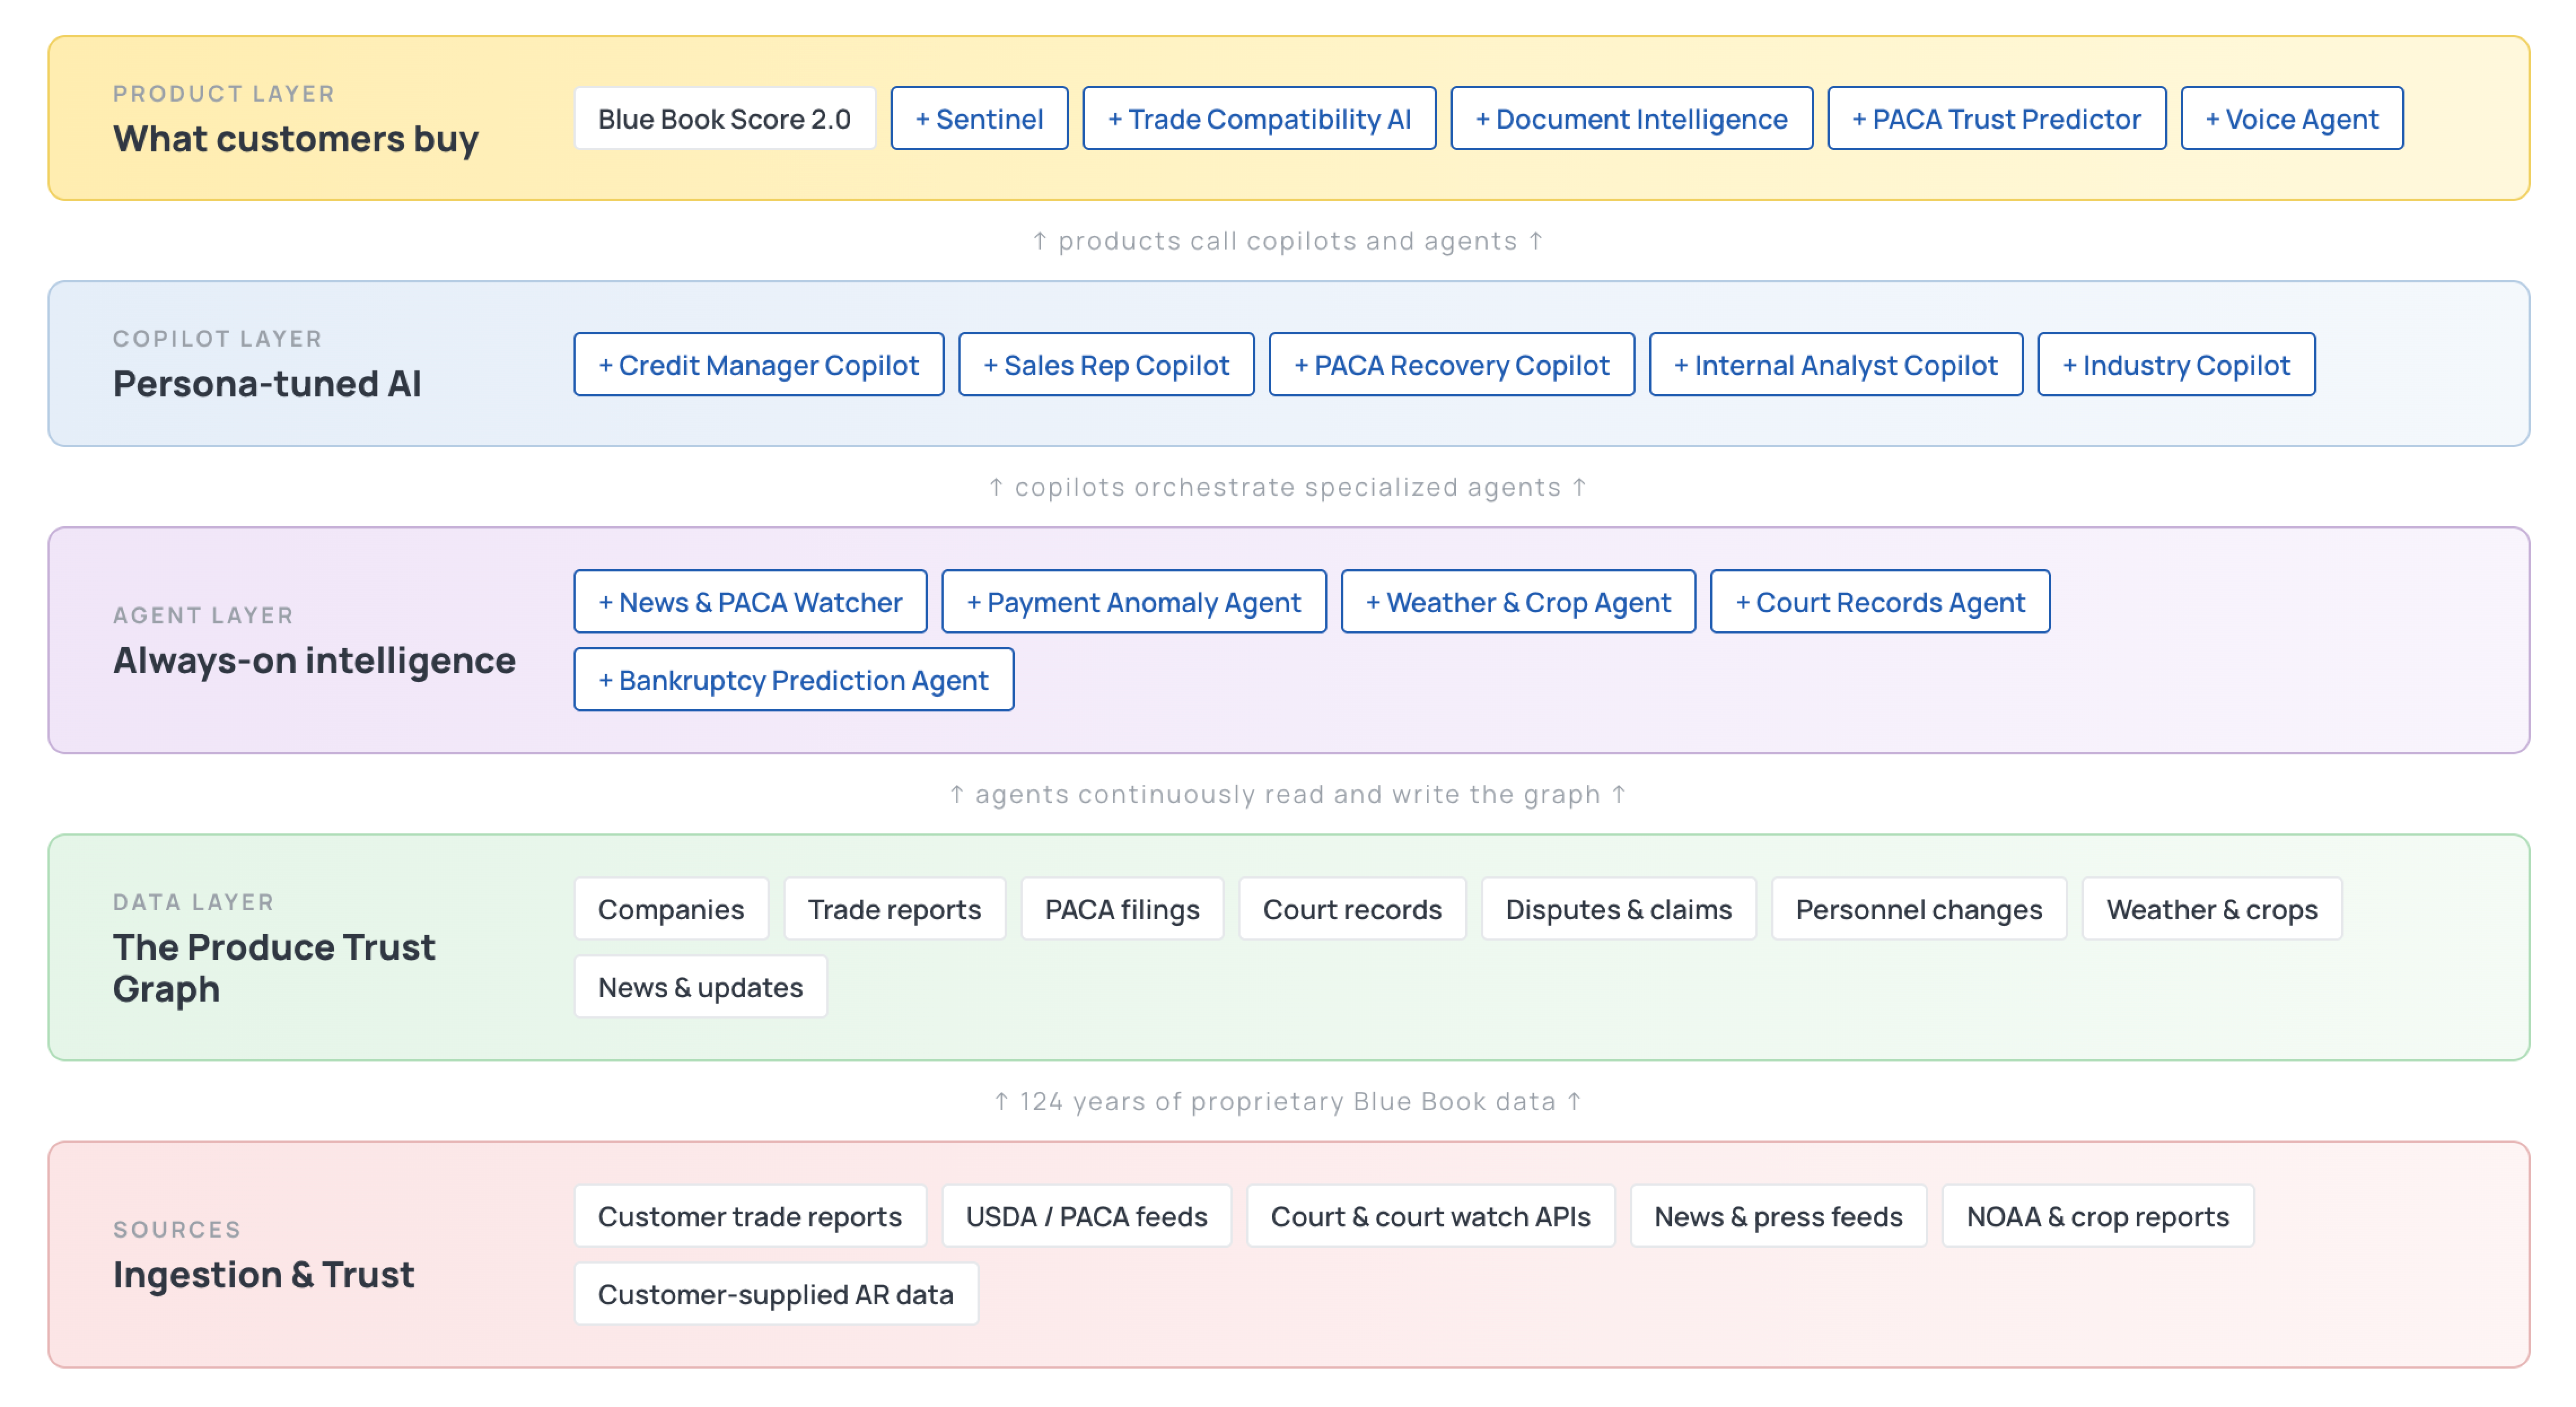
CASE 3 · PROPOSED
AI runtime & agent vision
+30%
Subscription revenue / member
Consolidated 9 plans into 3 while raising prices 10–50%.
98%
Customer retention
Customers welcomed the price increase. CEO + VP Sales sent thank-you notes.
$420K+
Sales in first 90 days
New acquisition funnel converted 169 paying members.